Advanced Options
Open Advanced Options with the gear in the model panel header. Each section's ? icon links here.
Units options
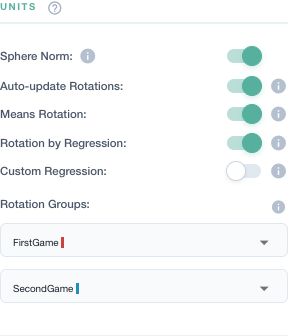
Sphere Norm
On (default): each unit's network is scaled to length 1, so units are compared on the pattern of their connections rather than on how many they made. Off: every network is scaled by the longest one, so units with more connections sit farther from the center. Applies to standard, transmodal, and ordered models.
Rotations
The rotation decides which directions in the network space become the plot's axes.
SVD is used when there are no groups to rotate on. It finds the axes that explain the most variance between units.
Means Rotation places the X axis through the means of two groups, so the plot shows their difference as clearly as possible. It needs exactly two groups.
Rotation by Regression (generalized means rotation) finds the biggest differences between group means while controlling for the nesting of your unit columns. It works with two or more groups. Turning it off returns to the original ENA rotations.
What it controls for: each unit's network is regressed on the top unit column (the groups) together with every intermediate unit column, with their pairwise interactions, in a lasso regression that leaves the group term unpenalized. The X axis is built from the group term alone, so variation that belongs to the intermediate columns is kept out of it. With units Condition > Session > Speaker, for example, the axis shows the Condition difference after adjusting for Session. This is rENA's
ena.rotate.by.generalized()with the group column and the intermediate columns asx_var. With only two unit columns there is nothing to control for, and the rotation gives the same axis as a Means Rotation.The adjustment changes the direction of the axis, not the number of units. The group statistics are still two-sample tests on every unit, so with nested units (the same speaker in several sessions) repeated observations of a person count as independent. Keep that in mind when reporting them.
Auto-update Rotations (on by default) sets these options for you from your unit selections, and re-sets them whenever the selections change. Turn it off to choose rotations yourself and keep them when you change units. Opening a set keeps the rotations it was saved with; they are only switched off if its groups no longer allow them.
Rotation Groups chooses the two groups the rotation is built on. They default to the first two groups in your units.
Custom Regression
With Rotation by Regression on, Custom Regression lets you choose the variables yourself:
- Regress on X: the variable the first dimension is regressed on, and whether it is Categorical or Numeric. The type is detected from the data, but you can change it.
- Control types: for each intermediate unit column, whether it enters the regression as categorical or numeric.
- Regress on Y: optionally, a variable for the second dimension. The column can't contain missing values. The plot's y-axis title then says "regressed on" that column, and each unit's label on the comparison plot (on hover, or always with Unit labels on) shows the unit's value for it.
The lists offer the columns that have one value per unit: your unit columns and any other column that never changes within a unit, such as a pre/post score. A Numeric variable needs a number for every unit; if some units have none, exclude them or treat the variable as Categorical. A categorical X is compared between the two Rotation Groups; a numeric X uses every unit.
Turning Custom Regression off returns the regression to the top unit column and resets the Rotation Groups to its first two groups.
Window options
| Option | When it appears | What it does |
|---|---|---|
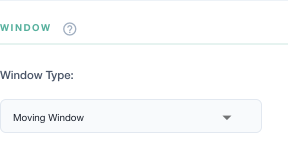
| Window Type | Standard models | Moving Window (default) or Infinite Window; Threaded isn't available yet. See Building a Model |
| Use end time | Time-based windows | Adds an End Time Column on the Windows tab |
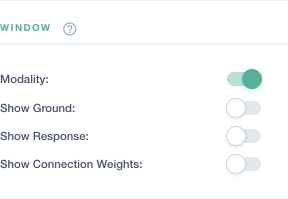
| Modality | Transmodal models | Shows the modality column on the Windows tab |
| Show Ground / Show Response | Transmodal models | Show the ground and response columns |
| Show Connection Weights | Transmodal models | Adds a weight to each entry in the window tree |
See Transmodal Analysis.
Codes options
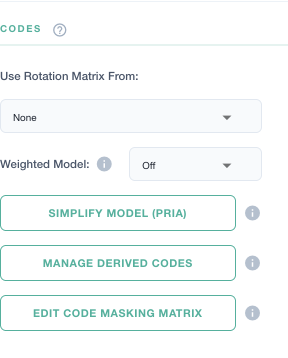
Use Rotation Matrix From
Rotate this set with another set's rotation, so the two models share the same axes and their plots can be compared directly. The list shows the other sets in the project that use the same codes and the same network type (standard or ordered, with or without self-connections). Choose None to use this set's own rotation.
Weighted Model
Chooses how each line's connections are counted before they are added up for a unit:
- Off (default): binary. A connection counts once per line where it occurs, however many times its codes appear.
- Product: the raw co-occurrence count, the product of the two codes' values on that line.
- Square Root or Natural Log: the product, dampened, so lines with very large counts don't dominate.
Weighted models aren't available for ordered networks.
Self-Connections
Off by default. When on, each code's connection to itself (the code occurring
again within the window) becomes a connection of its own, written A & A. Six
codes then give 21 connections instead of 15. Self-connections are included in
normalization, rotation and node positions, and each one is drawn as a dot on
its code's node. The weighting is the same as R rENA's
accumulate(self_connections = TRUE).
Ordered networks always include self-connections, so there the switch shows on and can't be changed. Your choice is kept if you switch back to a standard network. A set with self-connections and one without can't share a rotation (see Use Rotation Matrix From). Simplify Model (PRIA) and the window-size recommendation still use the model without self-connections.
Simplify Model (PRIA)
Opens the PRIA dialog; see Simplify Model.
Derived and nested codes
Manage Derived Codes (or the forked-arrow icon on the Codes tab) opens the editor for compound codes (A & B) and nested subcodes (B ⊆ A); see Compound & Nested Codes.
Code masking matrix
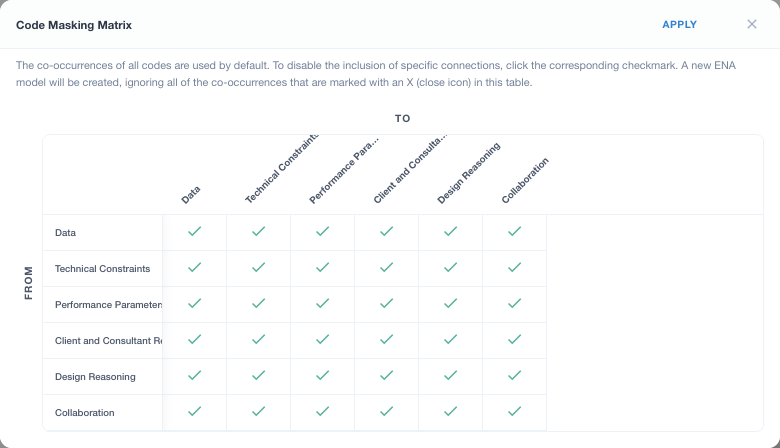
Edit Code Masking Matrix lists every connection between codes. Click a check mark to switch that connection off (✕); the model is rebuilt without it. Standard models show one triangle of the matrix, since A–B and B–A are the same connection; with Self-Connections on, the diagonal (A & A) is included. Ordered models show the full matrix, with FROM and TO axes, so each direction can be switched separately. Reset to Default restores all connections; a Modified badge on the button shows that the mask has been changed.
Connections masked by a compound or nested code are shaded and can't be switched back on while the rule exists. Hover one to see which rule masks it, for example residual and subcode of Design Reasoning.
Statistics options
Significant Digits (0–6, default 2) sets how many decimals are shown in statistics.