Plots & Units
Comparison plot
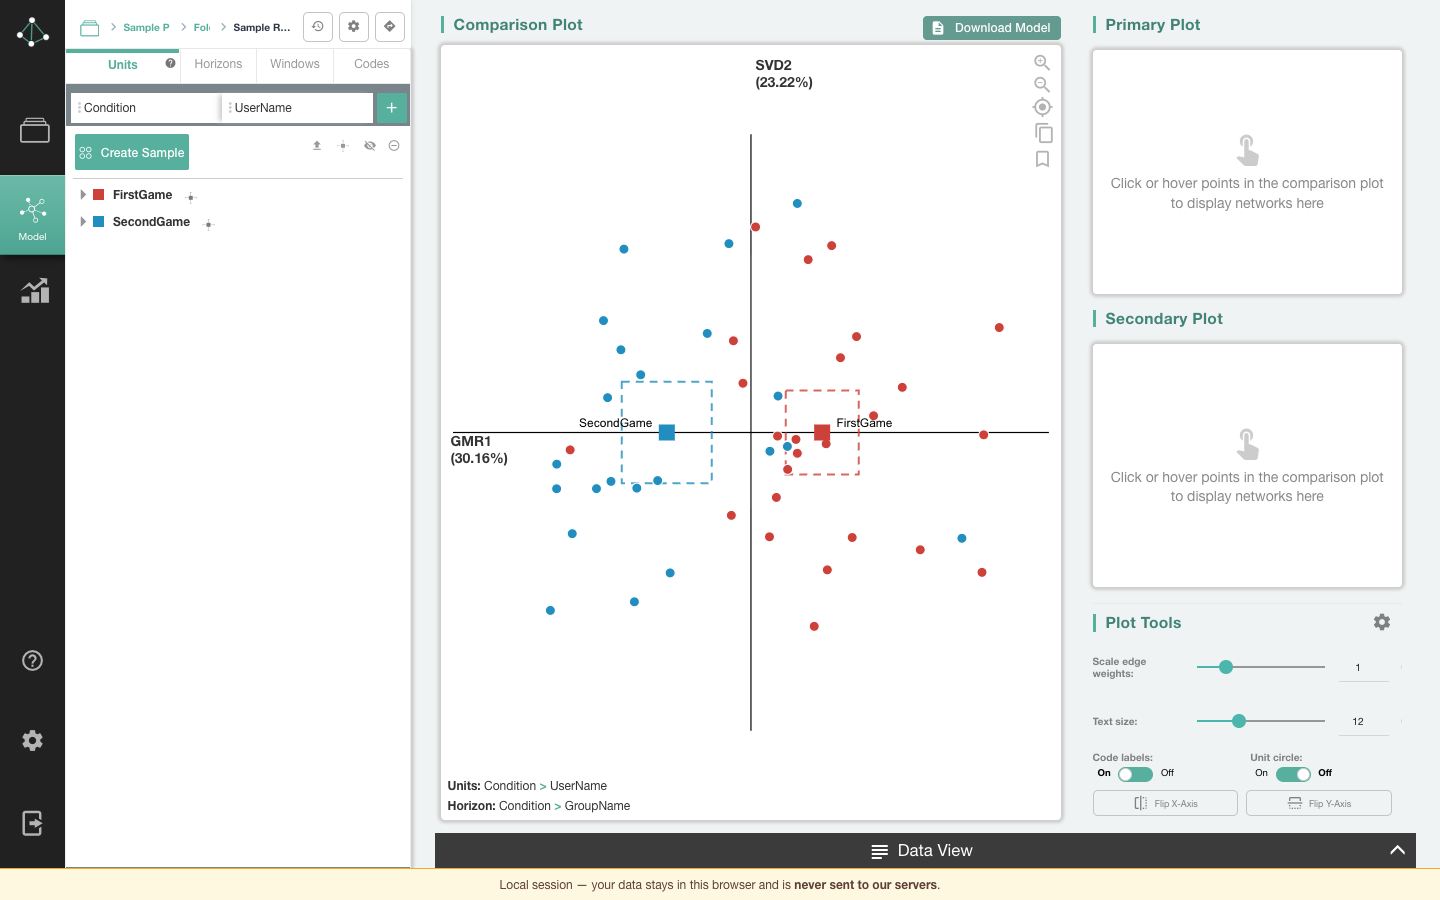
The comparison plot in the middle of the screen shows every unit as a point in the ENA space. Units that make similar connections sit close together.
- Nodes are the codes. Their positions are fixed for the whole model, so networks drawn at the same positions can be compared directly.
- Group means are drawn as squares, with optional confidence and outlier intervals (see Means).
- Hover a point or group mean to preview its network and see its name; click it to put it in the primary and secondary plots. A plotted unit keeps its label.
- Click a connection to open the Data View on the lines behind it; hovering a connection shows its weight below the plot.
- Click a code to hide or show its label.
- Drag a label to move it. Unit and group label positions are saved with the set; a moved code label moves on all three plots.
- The axis labels show each dimension's name and, optionally, the variance it explains. A warning icon by an axis means its goodness of fit is below the recommended threshold; click it for details. See Statistics.
When you change the model (a different window, a flipped axis, an added code), the points, means and networks move smoothly to their new positions.
Zooming and panning
- Scroll (or pinch on a trackpad) to zoom toward the pointer, and double-click to zoom in on a spot.
- Drag an empty part of the plot to move it around.
- On a touch screen, pinch to zoom and drag with one finger to move.
- The controls on the plot zoom in and out, recenter the plot, and copy the plot image to your clipboard, ready to paste into a document or slide.
Zooming spreads the layout without changing the size of nodes, edges, or points.
Downloading plots and data
Download Model (above the comparison plot) exports the comparison, primary, and secondary plots as images, and optionally the model data: nodes, coordinates (point positions), line weights (normalized networks), and connection counts.
Primary and secondary plots
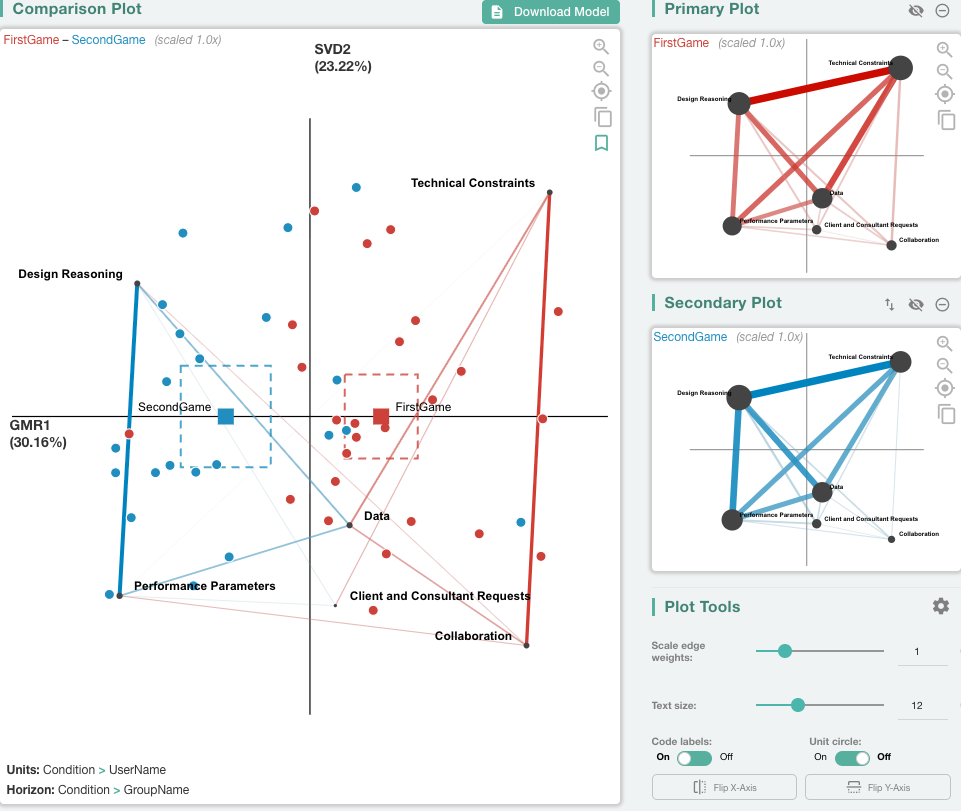
The panel on the right holds two side plots. Click or hover points in the comparison plot to fill them. Each plot can be hidden or removed, and Switch Plots swaps them. When both are filled, the comparison plot shows the difference between them.
Plot Tools
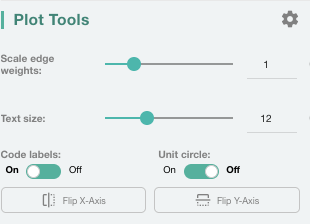
Plot Tools, below the side plots, change how networks are drawn without changing the model:
- Scale edge weights: make edges thicker or thinner (0.1–4, default 1).
- Text size: the size of code labels (8–20, default 12).
- Code labels: show or hide node labels.
- Unit circle: place the nodes evenly on a circle in the plotted dimensions instead of at their optimized positions. The points stay where they are, and goodness of fit and downloads reflect the moved nodes.
- Flip X-Axis / Flip Y-Axis: mirror the plot along an axis.
The gear opens Plot Settings:
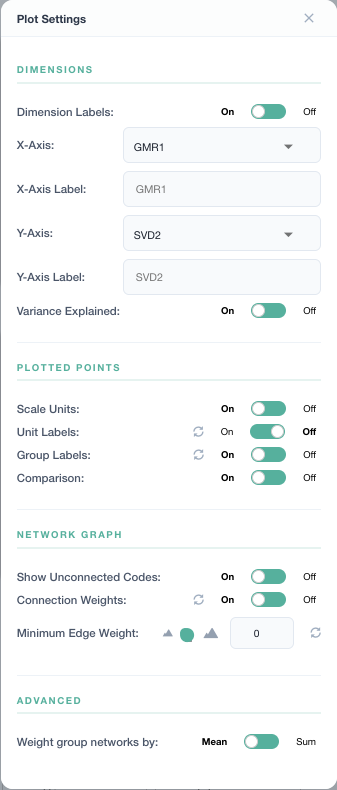
| Setting | What it does |
|---|---|
| Dimension Labels, X-/Y-Axis, axis labels | Choose which dimensions are plotted and rename the axes |
| Variance Explained | Show each axis's share of variance |
| Scale Units | Scale points to fit the plot |
| Unit Labels / Group Labels | Label every point and group mean. With Unit Labels off, a unit's label still shows while you hover it and while it is plotted |
| Comparison | Show the difference network when both side plots are filled |
| Show Unconnected Codes | Draw nodes that have no connections |
| Connection Weights | Show edge weights |
| Minimum Edge Weight | Hide edges below this weight (0–1) |
| Weight group networks by | Draw a group's network as the mean or the sum of its units' networks |
The units tree
Once a model is built, the Units tab lists the units, grouped by your unit columns. Each row has:
- a color swatch: click it to choose the group's colors;
- a hide icon: hide or show the point(s);
- an exclude icon: exclude the unit, or every unit in the group, from the model;
- for groups, a Mean Options menu (see Means).
The toolbar above the tree can collapse the tree, set the global mean options, and show/hide or include/exclude every unit at once.
Hide or exclude?
| Hidden unit | Excluded unit | |
|---|---|---|
| Drawn in the plot | No | No |
| Part of the model (rotation, positions) | Yes | No |
| Counts toward its group's mean | Yes | No |
| Its lines give context to other units' connections | Yes | Yes |
Hide a unit to declutter the plot; exclude it when it shouldn't be modeled. For example, excluding the teachers in a classroom dataset keeps the connections students make to what teachers said, without adding the teachers to the model.
Means
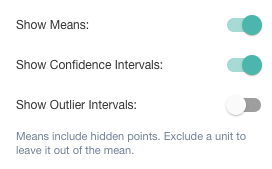
The Mean Options menu (globally in the toolbar, or for one group on its row) has:
- Show Means: draw the group mean.
- Show Confidence Intervals: draw the 95% confidence interval of the mean.
- Show Outlier Intervals: draw the outlier interval (1.5 × the interquartile range); units outside it are unusual for their group.
The interval options apply only to a drawn mean, so they are disabled while means are off. Means always include hidden units; exclude a unit to leave it out of the mean.
Custom groups (samples)
Create Sample builds your own group of units. In Sample Mode, click unit names or points in the comparison plot to add or remove them, or drag a box around points to add them all (drag the same box again to remove them). Then name the group, pick its color, and Save. The plot doesn't zoom or move while you select; use the zoom controls if you need to. Custom groups appear at the top of the tree, where you can edit or delete them, and can be compared like any other group: the plot shows the group's mean, confidence interval and its units' points in the group's color. A unit in a custom group is modeled even when it is excluded in the units tree, so a hand-picked group can stand in for an excluded condition; the excluded unit itself, and an excluded group, draw no point or mean of their own.
Data View
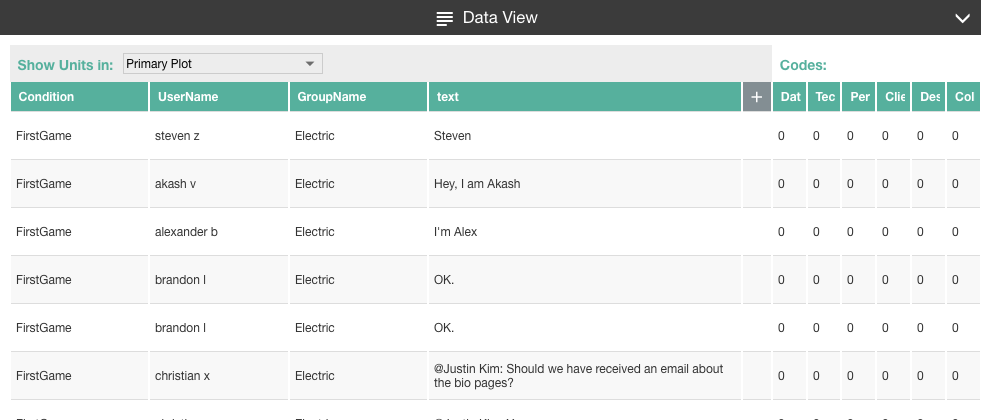
The Data View drawer along the bottom of the screen shows the lines of data behind the selected networks, with the codes for each line.
- Show Units in chooses whether to show the lines of the primary or the secondary plot's units.
- Lines in the active window are highlighted when you hover a connection.
- Click + to add metadata columns, drag column headers to reorder them, and drag a header's edge to resize it.
- Runs of lines that aren't relevant are collapsed; click the arrows to expand them.