Statistics
The Stats tab (third icon in the left rail) has three tabs: Comparison, Dimensions, and Theory & Methods.
Comparison
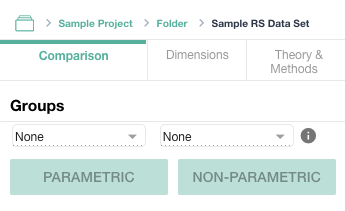
Test whether two groups differ along each axis of the plot.
- Choose two groups. Groups that share units are removed from the choices.
- Click Parametric for two-sample t tests, or Non-Parametric for Mann–Whitney U tests.
For each axis, the results show:
| Test | Reported |
|---|---|
| Parametric | t, degrees of freedom, p, Cohen's d, mean, standard deviation, N |
| Non-parametric | U, p, effect size r, median, N |
Results significant at p < 0.05 are marked. Generate Write-up drafts a short paragraph describing the result (see AI features).
The results always describe the current model: whenever the model is rebuilt (a change to its units, horizons, window, codes or rotation) or you choose different groups, the same test runs again on the new model. If one of the compared groups no longer exists, the results are cleared until you choose two groups and run a test again.
Dimensions
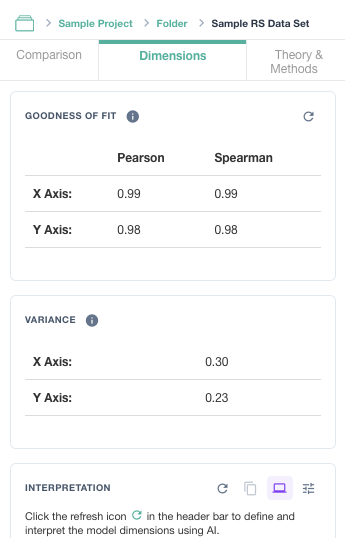
Goodness of fit
Goodness of fit measures how faithfully the plot represents the networks: the Pearson and Spearman correlations between distances in the plot and distances between the units' networks, for each axis. Values close to 1 mean the plot is a reliable picture of the data. Values below 0.9 are flagged with a warning, here and next to the plot's axis labels. Click the refresh icon to recalculate them.
Variance
The share of variance in the networks that each plotted axis explains.
Interpretation
Click the refresh icon to have AI suggest what each dimension represents, based on the codes at either end of it. Review the result before using it.
Theory & Methods
Generates an academic write-up of the model's theory and methods, which you can copy or open full-width. Review it for accuracy before using it in research or publications.
Bracketed placeholders mark what only you can supply. If the model uses webENA's recommended window size, the Methods say so and cite the method behind it; if you set a different window, a placeholder asks you to justify it.
To get a shorter write-up, enter a number of words in Length limit, just below the Theory & Methods header, then click refresh. The limit covers the Theory and Methods together (at least 100 words), split between them in proportion to their length, with at least 40 words for each. The AI shortens each section to its share, and may leave details out, but it can't add citations, numbers, or placeholders that aren't in the template. If its version is still well over, or the AI isn't available, the section is cut at the sentence end nearest its share; a sentence is never cut in the middle. The References list only the works the shortened text still cites.
AI features
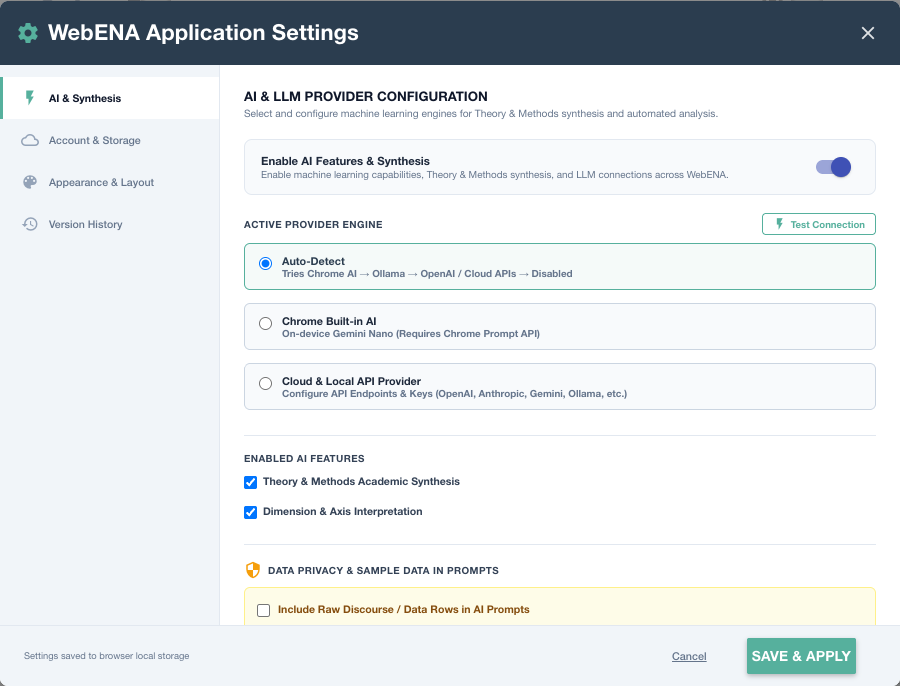
The write-ups and interpretations use an AI provider, configured under Settings › AI & Synthesis:
- Auto-Detect tries Chrome's built-in AI, then a local Ollama, then a configured cloud API.
- Chrome Built-in AI runs on your device.
- Cloud & Local API Provider uses an endpoint and API key you supply (OpenAI, Anthropic, Gemini, Ollama, or a custom endpoint). Test Connection checks it.
You can turn each AI feature on or off. Include Raw Discourse / Data Rows in AI Prompts controls whether sample lines of your data are sent with the prompt. Local providers keep this on your machine; cloud providers receive it over the network.
Significant Digits in Advanced Options sets how many decimals statistics are shown with.